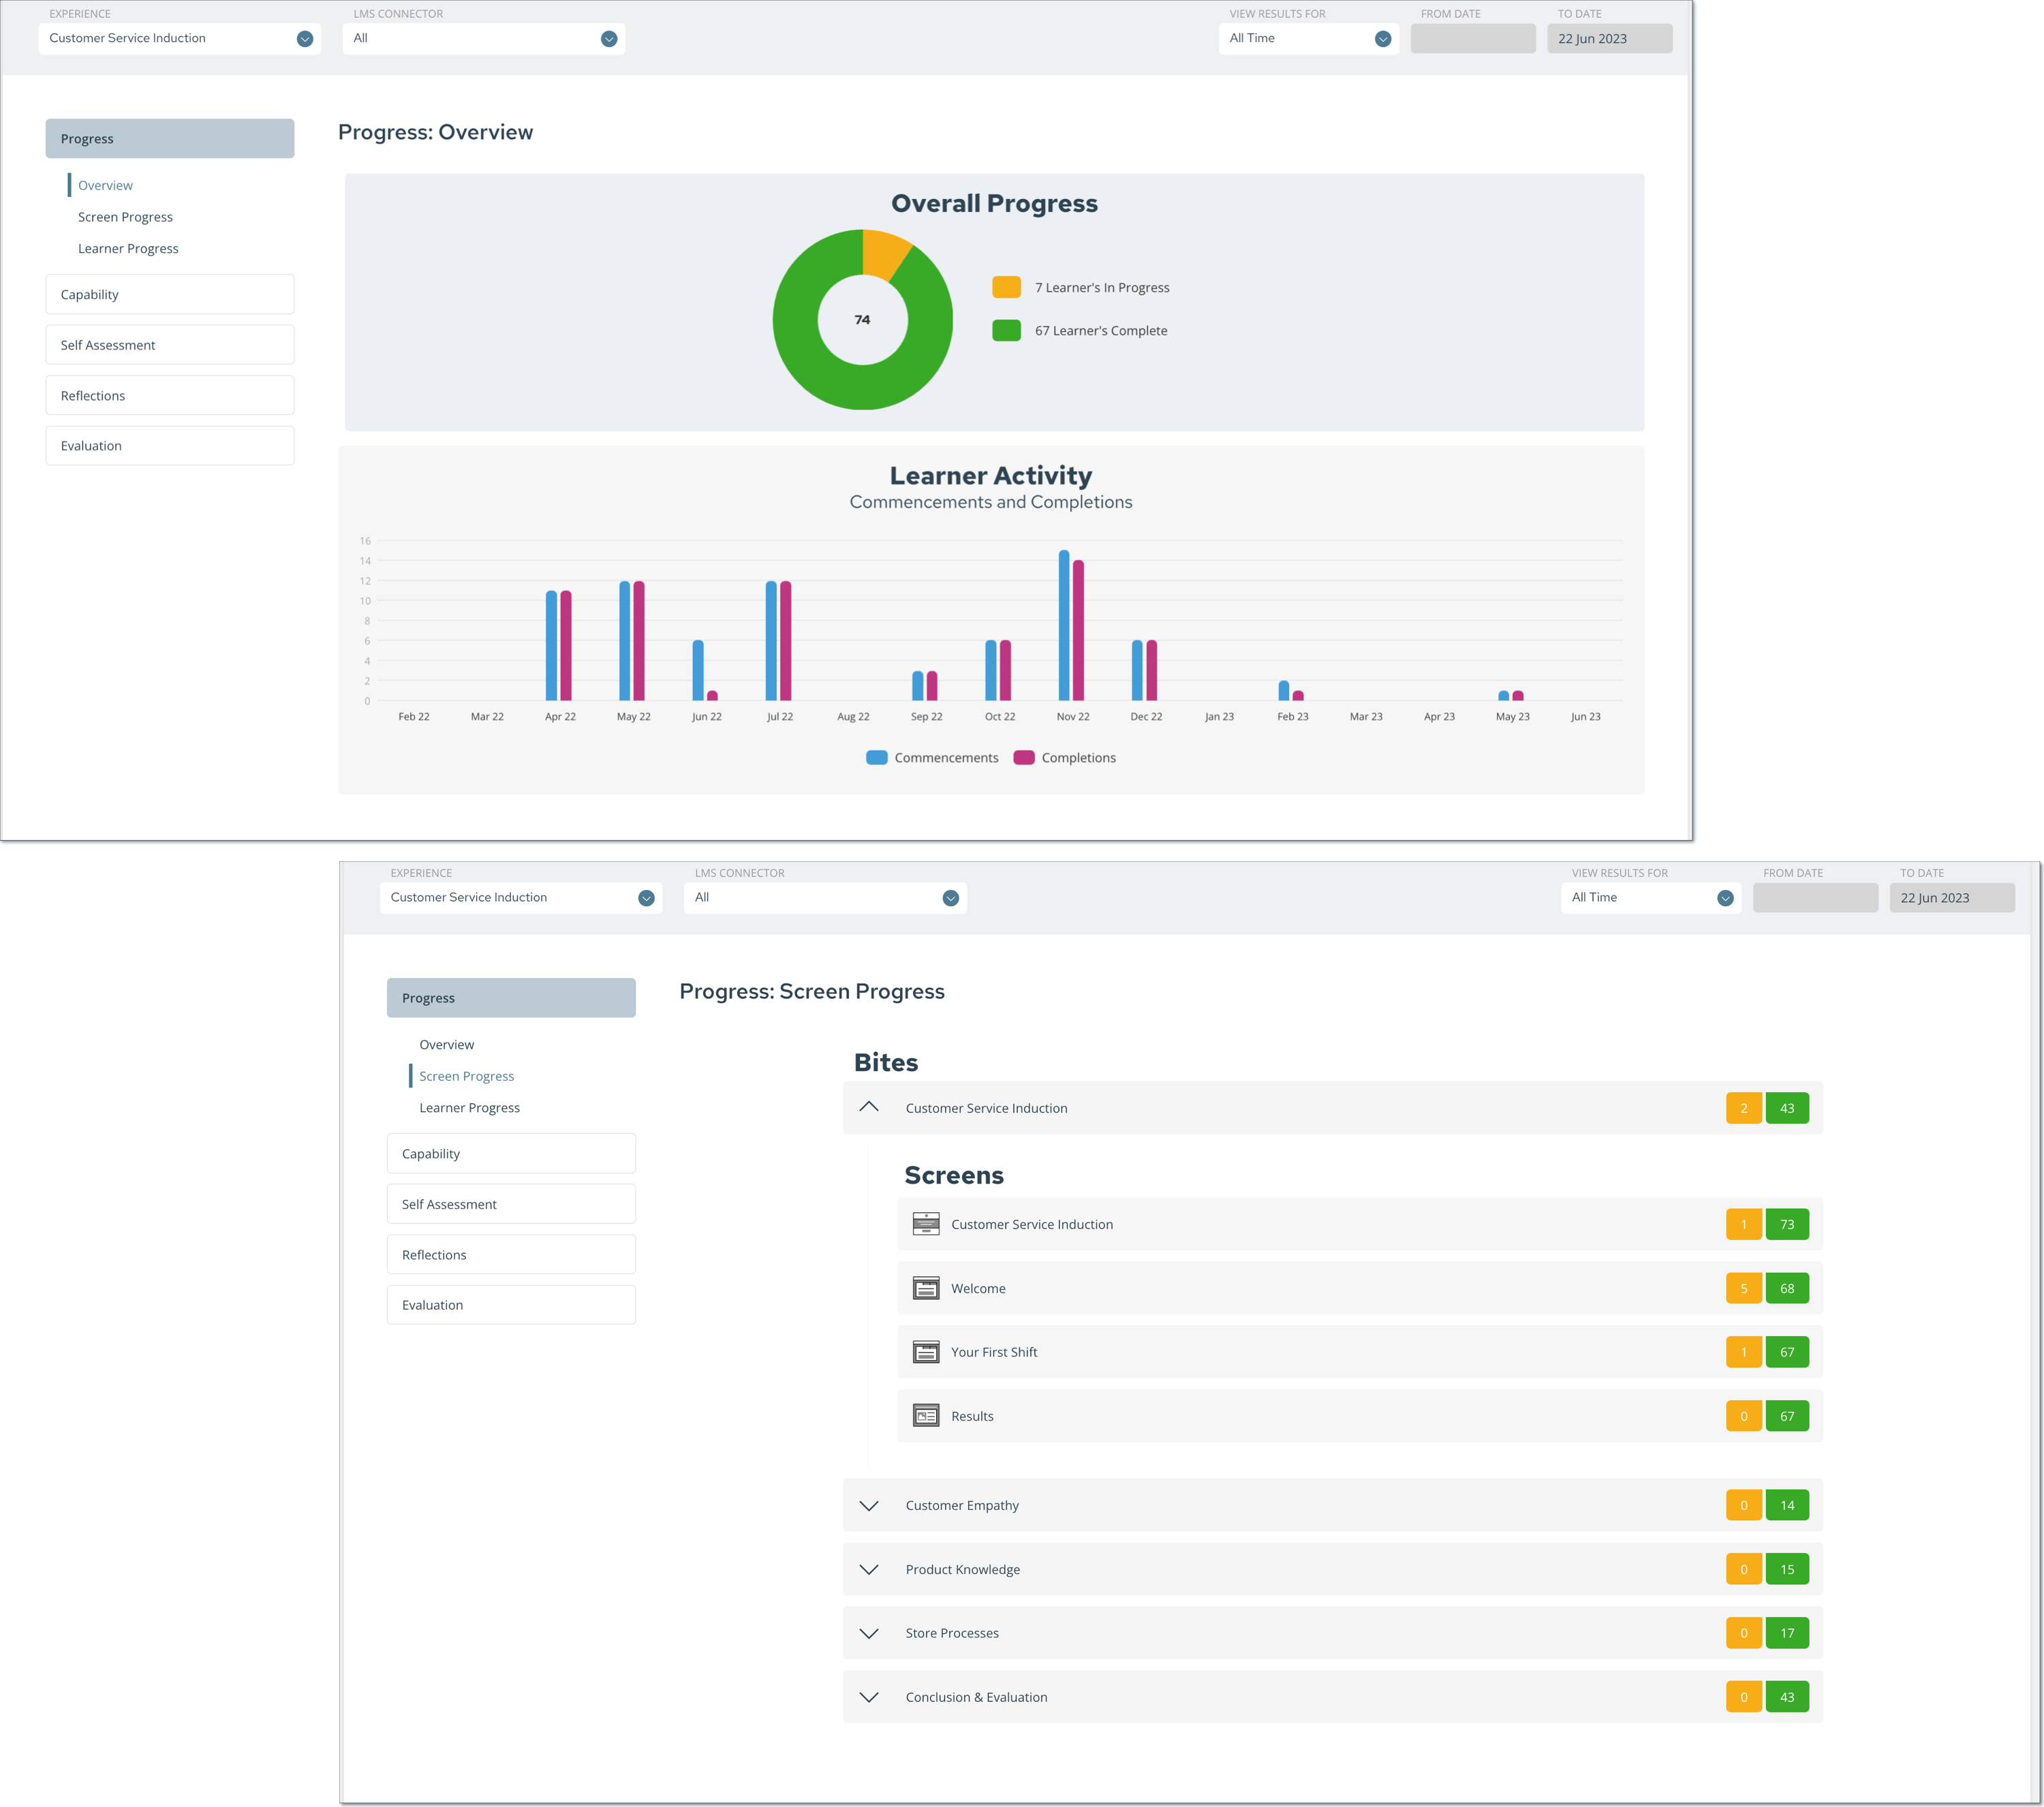
The Completion dashboard is a place for you to view each learner’s overall progress and activity from the time they begin to the time they complete the program.
This information is further broken down within the learners' progress tab, where you can find information regarding the learners' average screen time, total score, and overall time spent on the module.
You can also view your program's commencement-to-completion ratio and overall progress visually in graphical charts in the overview tab of the completions dashboard for the last week, month or 3 months.
This promotes transparency between learners and program leaders, whilst also allowing for learning designers to utilise this information to understand program flow for more efficient and effective learning.
